28 Jun 2026
Heatmap Analytics Reveal Strategic Shifts in Competitive Team Coordination Protocols
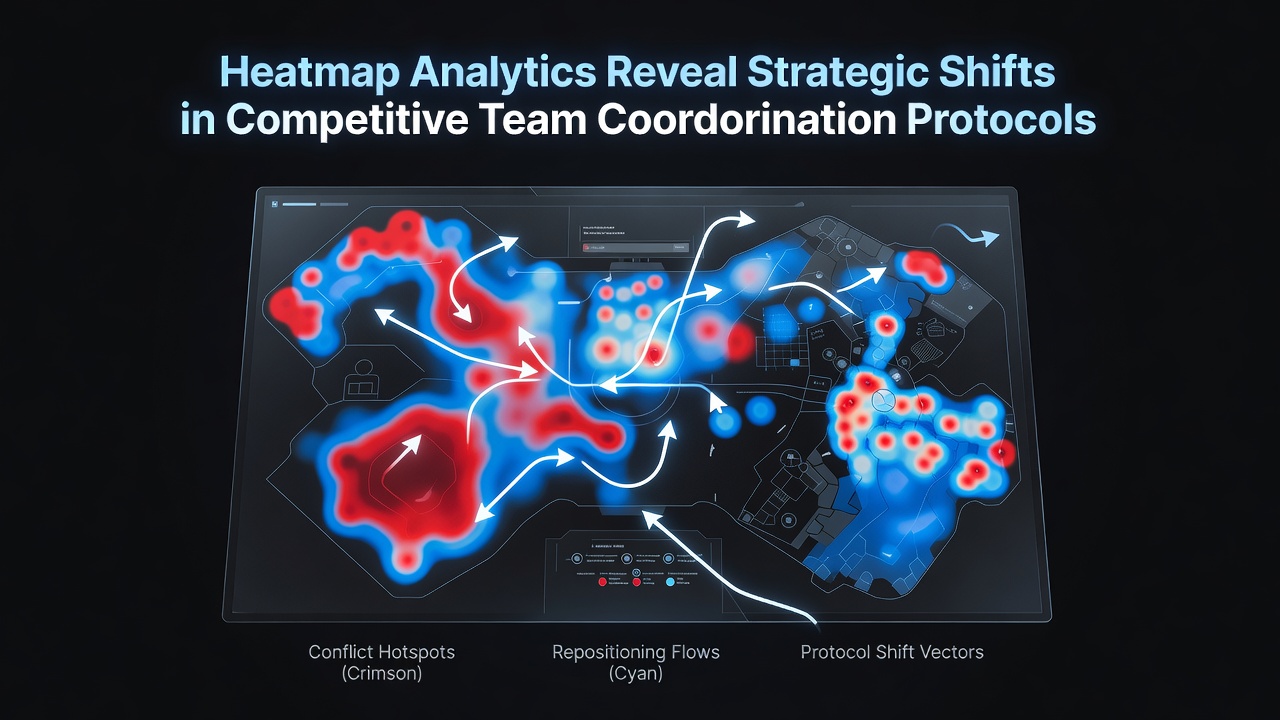 Heatmap analytics have transformed how competitive teams examine coordination protocols by converting raw positional data into visual patterns that highlight movement clusters and decision points during matches, while analysts combine these visualizations with timestamped action logs to trace the evolution of team strategies over entire tournaments. Researchers process thousands of data points per second from in-game tracking systems, which allows them to identify where players concentrate their efforts and how those concentrations change in response to opponent tactics. Teams in titles that emphasize objective control now rely on these tools to refine rotations and resource allocation, since the colored intensity zones reveal both successful holds and overlooked vulnerabilities that traditional replay reviews might miss. Data from major circuits indicates that coordination protocols have moved away from rigid lane assignments toward fluid role swaps that adapt in real time, and this adjustment appears most clearly in heatmaps that track support players drifting between mid-lane skirmishes and jungle pathing adjustments. Observers note that early 2025 seasons already showed increased overlap in high-traffic zones near contested objectives, yet the patterns sharpened further during the June 2026 championship cycle when teams integrated live heatmap feeds into their bench-side coaching stations. The result shows squads spending less time in static defensive postures and more time executing synchronized advances that compress opponent response windows.
Generation and Interpretation of Positional Heatmaps
Competitive organizations collect telemetry through standardized APIs that log player coordinates at sub-second intervals, then feed those coordinates into rendering engines that produce layered heatmaps distinguishing between different game phases such as laning, mid-game skirmishes, and late-stage sieges. Analysts overlay multiple matches on the same map template to surface recurring paths, which reveals whether a team favors split-push pressure or centralized fights around key structures. Software filters allow isolation of individual roles so that teams can compare how their damage dealers versus their frontline tanks occupy space under varying pressure levels.
Studies conducted by the University of Sydney esports analytics group demonstrate that heatmaps become particularly revealing when cross-referenced with communication timestamps, since vocal or ping data often precedes visible repositioning by several seconds. This correlation helps coaching staffs isolate moments where verbal protocols either accelerate or hinder the physical movements shown on the map. Multiple teams now archive these combined datasets after each scrimmage block, creating longitudinal records that track how coordination habits evolve across weeks of preparation.Documented Shifts in Team Protocols
Heatmap comparisons between 2024 and 2026 seasons illustrate a measurable contraction in average distance between teammates during objective contests, which suggests tighter grouping protocols have replaced earlier spread formations designed for map vision. Mid-lane players appear more frequently in side-lane heat signatures during the June 2026 tournaments, indicating deliberate cross-lane rotations that pull defenders out of position before committing resources to the primary target. Support units show expanded coverage arcs that extend deeper into enemy territory, a pattern consistent with aggressive vision denial strategies rather than reactive warding behind their own lines.
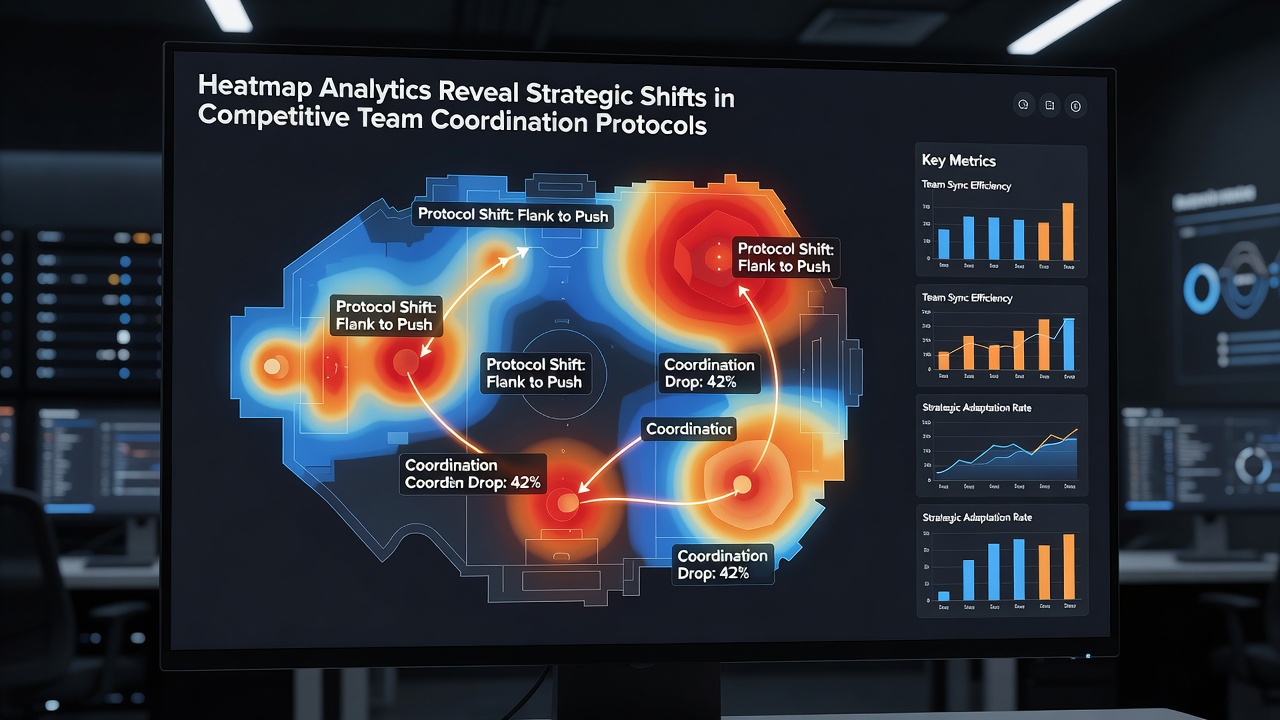 One European squad documented a complete reversal of their early-game pathing after reviewing heatmaps that exposed predictable routes opponents had begun to exploit, while North American organizations adopted similar adjustments following shared data sessions at regional qualifiers. These changes manifest as broader color distribution across previously underutilized map corridors, confirming that teams are deliberately varying their approach angles to reduce predictability.
Integration With Training and Real-Time Decision Systems
Training facilities now project heatmap layers onto physical tabletops during review sessions, allowing players to trace their own routes against ideal coordination vectors generated from aggregated opponent data. This tactile method helps reinforce muscle memory for positioning without requiring constant screen focus, and it pairs naturally with the live overlays some organizations have begun testing during official matches under tournament-approved conditions. Performance metrics derived from these visualizations include time-to-objective and clustering efficiency scores, both of which feed directly into post-match debrief algorithms.
Industry reports from the Global Esports Federation highlight how smaller organizations leverage open-source heatmap tools to close the gap with well-funded programs, since the underlying positional data remains accessible through public match APIs. The federation’s 2026 technical brief notes that protocol standardization across regions has accelerated because teams can now reference the same visual benchmarks regardless of their home server location.Conclusion
Heatmap analytics continue to surface incremental refinements in competitive coordination protocols by making spatial relationships visible at scale, while the June 2026 dataset in particular underscores how teams have adapted their movement patterns in response to these insights. Continued refinement of data layering techniques promises even finer resolution of decision trees that separate successful rotations from those that collapse under pressure, giving organizations concrete visual references for adjusting their approaches before the next cycle of matches begins.